Search the Site
The Fred Report - Weekly May 2, 2016
The FRED Report - Financial Research, Education & Data
Volume 8, Issue 33
Trading Week Starting May 2, 2016
Download PDF Version here
Summary of Market View
In the Stock section we discuss some indexes as adjuncts to the normal ones we discuss in the Monthly Review (out later this week). The bottom line is the market is vulnerable here, but if it holds we should see further advance. We still have a target of 223 for SPY for this year.
In Fixed Income, we discuss high yield bonds and give some ideas for what has worked so far and what should work going forward. We still prefer BKLN. In the Commodities section we discuss gold and silver, and give some price points on each. Gold is much improved.
In the International and also the Chart of Interest section we discuss Japan, the dollar, and the yen. We have done well in these markets and there could be changes over the next few months.
Stock Review
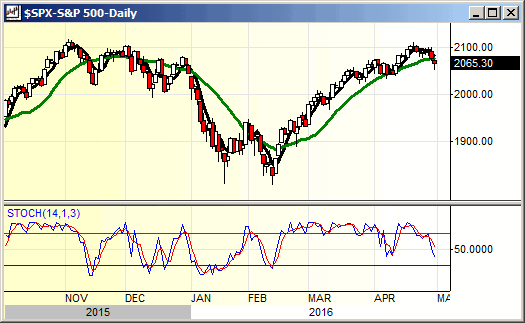
Stocks have arrived at an interesting point in time and price. Stocks have struggled with this resistance area for some time, and have started to pull back. This is a vulnerable setup, perhaps the most important since the trading bottom in February. We are still working on the Monthly Review, and will show some different charts here, but the message of the market is that we could see some correction from this area, and we have given some downside targets in other venues (202, then 197, and 186 on SPY). There are a lot of pluses and minuses at this juncture. IWM has improved relative to SPY, a plus showing the market is broadening out. On the other hand, IYT has had a down month suggesting that the Dow Theory sell signal is alive and well. We will not make a forecast here, preferring that the market tell us what it wants to do but we will discuss some of the indicators.
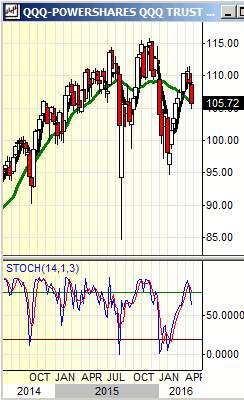
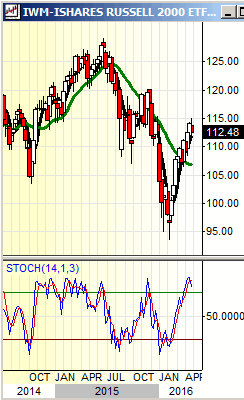
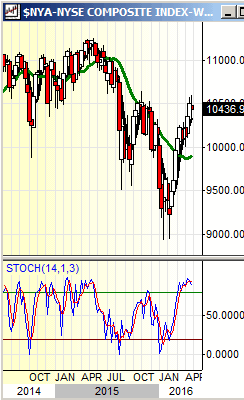
The daily stochastic is in sell mode for most indexes, and the weekly is overbought, which suggests more downside is possible than most participants expect. The other thing to notice is that the divergences between SPY, IYT, and IWM still exist, but these have been so widely remarked upon that they may not have a big effect on the market other than what we have seen over the last 6 months. Indexes such as IJR and MDY have failed at weekly resistance points, commensurate with SPY. We show this in the Monthly so we will look at QQQ, IWM, and NYA. These have also failed at similar points and looking gives a different picture than SPY. Still, the market could rally from this area – indicators are mixed. We are fine here as long-term investors holding some cash, and would deploy it on a successful test of 202 on SPY. This pattern should resolve itself over the next week or so, for now we will watch and wait.
Fixed Income Review
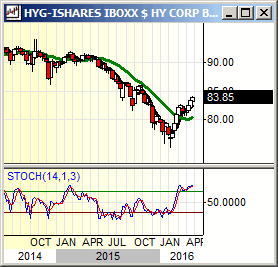
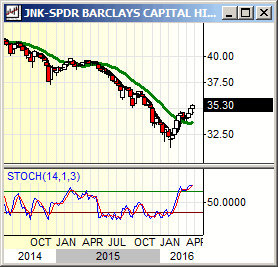
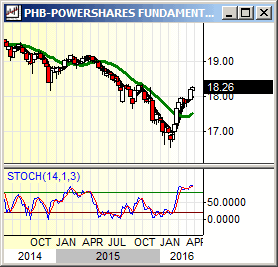
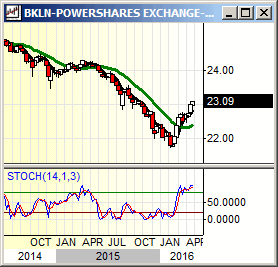
We have not looked at High Yield in some time, and will look at this and BKLN here. We follow three main ETFs in the high yield area. These are HYG, JNK, and PHB. BKLN is not strictly high yield, although it has some high yield characteristics. It is a floating rate ETF.
Our favorite of the three High Yield ETFs has been PHB, and in the latest turmoil in this area it has performed better than the other two. It is above the 12/19/14 low while HYG and JNK are still below that area. These are overbought on weekly stochastics, and in resistance, suggesting some more choppiness and backing and filling, even if there is further advance in the second part of 2016. We will consider PHB on a pullback in this area should this occur into the June/July timeframe. We have already been using BKLN in our portfolios. While it has not traded through that December 2014 low it is close and it has fallen less on a percentage basis. We think the floating rate characteristics of the ETF will do well in the second half of 2016 as we think rates will rise. We show charts, below, and suggest buying BKLN or PHB on pullbacks.
Commodity Review
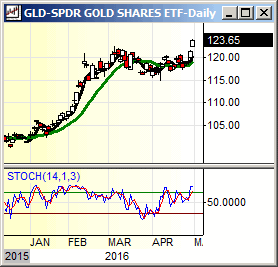
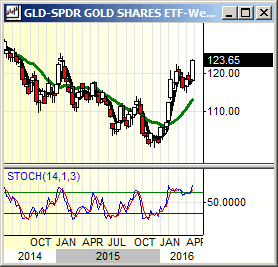
GLD has seen another significant milestone. Our long-term moving averages have crossed to the positive side for the first time since February of 2013 (at 154 or so). So that method produced a sale in the 154’s and a buy here at 123.65. Resistance at 120 has been exceeded, and this combination of signals suggests higher prices are in store in spite of the short-term overbought readings on some of the indicators. Several Advisors have asked what this could mean? The answer is mostly a guess, but one logical answer is that it means that inflation is (finally!) returning to the global economy, a plus. Price targets on the upside are now 130 or so, followed by 130, and the real resistance at 150.
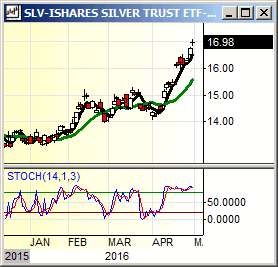
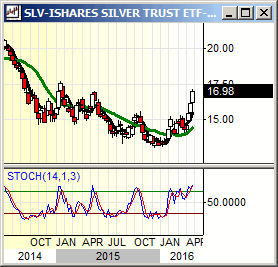
Over the last week or so we have also been asked about SLV (Silver). Long-term moving averages are still negative on SLV, in contrast to gold so it is still lagging, a plus, SLV has resistance in the 20-area, and then the gap at 25. We have been asked about the gold/silver ratio. This is a fundamental indicator so we will give abbreviated commentary.
The most important thing about this indicator is that it is more of a condition indicator rather than a timing tool. There have been numerous instances where this measure of value has moved in favor of silver and stayed in that mode until a bull move in the metals has ended. We should mention one last thing about silver. This is that out performance in silver relative to gold has been associated with the end of bull moves in the metals. You can see this by comparing GLD and SLV in 2011 – 2012, we will show these charts below.
International Review
Japan is in an interesting position, as the latest news out of Japan has been favorable to the Yen (see chart of Interest, below). For some time (since March 2015), we have been recommending use of the non-currency hedged ETFs vs. the hedged ones. We did this due to a March Wall Street Journal article while we were in Minnesota suggesting that 100% of hedge funds were short the Euro.
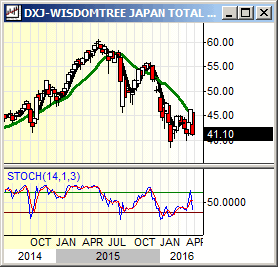
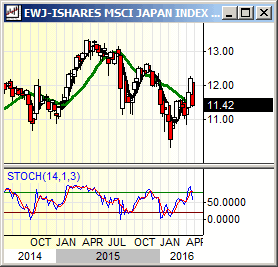
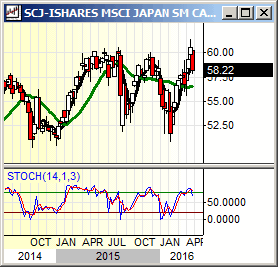
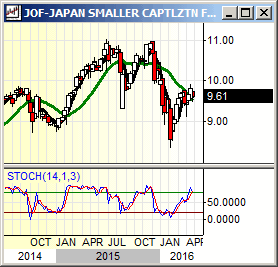
We look at several Japanese ETFs. These are DXJ (Wisdom Tree Japan Hedged Equity Fund ETF), EWJ (iShares® MSCI Japan Index Fund), SCJ (iShares® MSCI Japan Small Cap Fund), and JOF (Japanese smaller capitalization). Of these, DXJ was a strong out performer as the Yen fell, but since March 2015 we have seen several of the non-hedged have been stronger.
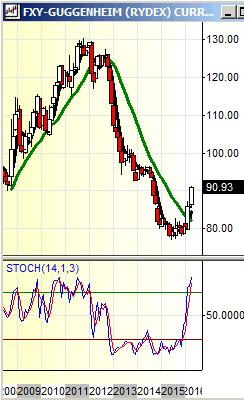
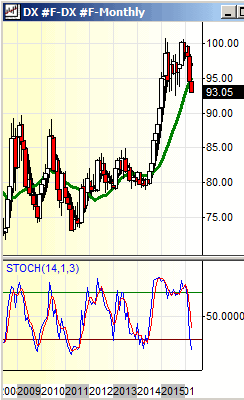
Now, there is some possibility that DXJ is hitting a tradable bottom in this area. First, the Monthly stochastic on DXJ has moved into oversold territory for the first time since 2012, although it has not yet given a buy signal. At the same time, our favorite of the Japanese ETFs, SCJ, is starting to fail at resistance and JOF, the other small cap Japanese ETF is faltering. The large cap EWJ is weakening but is still showing some relative strength. Our concern is that the dollar is approaching our target price area in the 91-area in the rough timeframe we have been looking for (again, see the Chart of Interest section below). We are watching for this, and suggest three types of market behavior to watch for.
The first is Japanese weakness in general. The second would be relative weakness of EWJ vs. DXJ. If this starts, it could go on for longer than currently expected. The third would be a rally in the dollar, which could take place starting in the May/June timeframe from the 91 area on DXY, and/or the 94- 98 area on FXY. Several clients of ours have substantial profits on Japanese stocks, and we would be ready to take some action if this market starts to change. We show the charts of the Japanese equity ETFS, below.
Weekly Chart of Interest
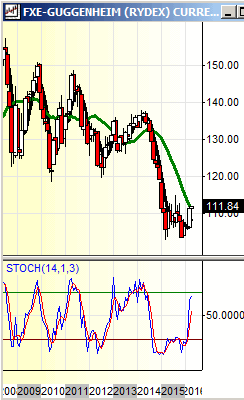
The dollar has finally broken down through the 94.50 area support and should test the 91-area forecast as our downside targets for this move. At the same time, FXY is approaching targets in the 94-98 area as mentioned in the International section. We show monthly stochastic charts, below, which suggest that the Yen has moved into overbought territory. The Dollar is not completely oversold, and this is because of the Euro. We show FXE also – it is in buy mode but not overbought. This suggests that a move up in FXE is what will move the dollar into our target area, suggesting non-hedged Europe could get a run here.
Member Log In

Who is Fred Meissner, CMT?
Listen here:
The FRED Report is not authorized, endorsed, or affiliated with the Federal Reserve of St Louis and its FRED Economic Data.


