Search the Site
The Fred Report - Weekly August 9, 2010
The FRED Report - Financial Research, Education & Data
Volume 2, Issue 63
Trading Week Starting August 9, 2010
Download PDF Version here
Summary of Market View
So far, the SPY has failed to move above resistance, but other indexes have gone through. We would be a bit defensive here, and use risk management, but frankly would be surprised if the market has peaked short-term.
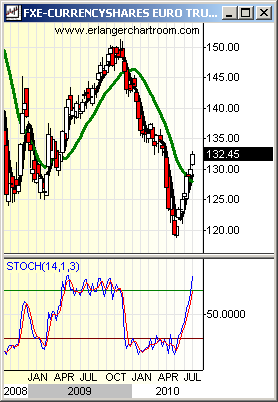
On page 3 we show international bonds and the Euro (FXE). We like BWX (SPDR Barclays Capital International Treasury Bond ETF) on pullbacks, should it occur.
We have had numerous questions on agricultural commodities and wheat, and note that this is the time when they are strongest seasonally. It is unlikely that agricultural commodities have a lot more upside from this juncture.
We note that Asia is perking up and Japan could have a decent run as the Yen looks a bit toppy.
We like gold as well, but a big move may not happen until late fall.
Stock Review
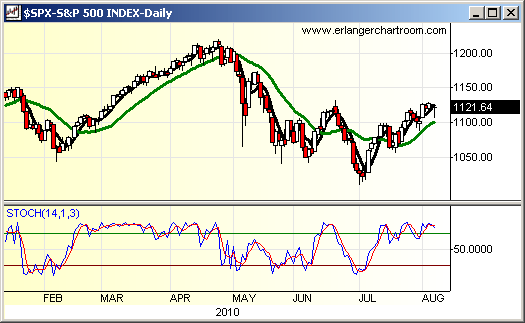
Last week, with the exception of Friday, was a pretty good week in terms of the indicators. While the market bounced back nicely at the close on Friday, so far we have failed at the resistance and until we move through 114 on the SPY, the SPY is in a downtrend. Conference level subscribers note that stops were raised on all stock and ETF idea generation positions to manage risk. We think we will exceed resistance in the coming sessions, but it is possible that we will fail and should that occur we want to be out of the market quickly. We also note that several key indexes have moved through the equivalent of SPY 114 already.
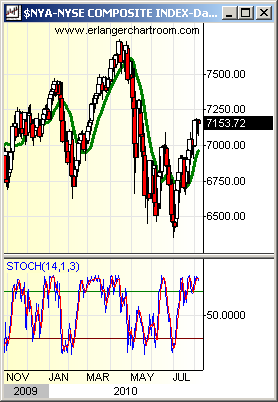
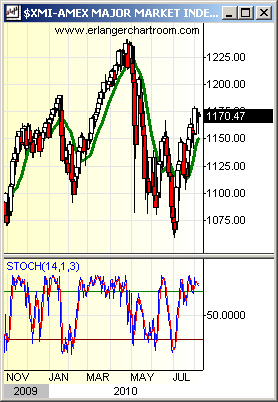
We show charts of the NYA (New York composite – all of the common stocks traded on the NYSE, a broad index) and the XMI (20 of the biggest blue chips). Both of these indexes have broken above that resistance – and this suggests the SPY also will do this.
Areas to watch below the market: gaps at 110 and the 107 area. Should we exceed the 114 area tests of 117, and then 120, would be expected.
Fixed Income Review
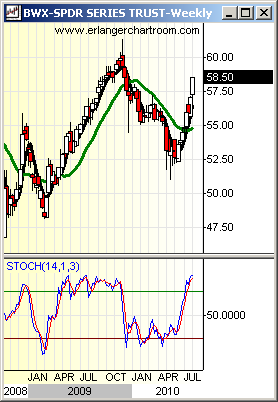
We have no change in our fixed income opinion, but will use today’s weekly to highlight the BWX (SPDR Barclays Capital International Treasury Bond ETF). This ETF had severe trouble when the Euro (see chart below) was weak in May. The key area on this chart is the 55 area that was violated on the downside as the Euro bottomed and has not been penetrated on the upside. We mention this ETF at this time because it looks to us as if a retracement of the advance could occur and we believe this would be a buying opportunity for international bonds. See the monthly later today for more information.
Commodity Review
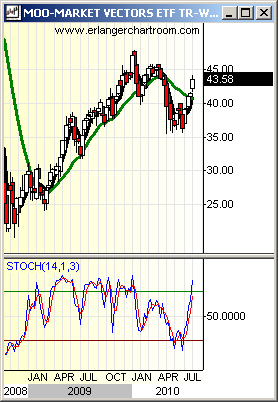
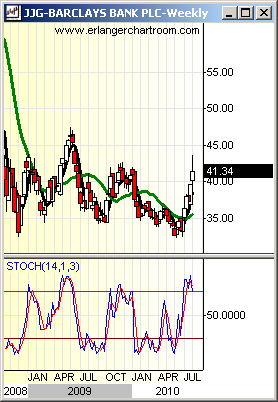
We have had a number of questions on the agricultural commodities. This is interesting because the agricultural complex often makes its’ highs for the year in August. There are two ETF’s we follow, one of which deals more with the physicals (JJG – iPath DJ-UBS Grains ETN), and the other deals more with stocks of companies working in that area (MOO – Market Vectors Agribusiness ETF).
Both charts are a bit overextended. MOO has outperformed since 2009, however JJG is a nice base, which could pull back, however. Given the seasonality involved in this case, for clients who simply have to be in – we would suggest using MOO, as some of the underlying stocks look attractive as well. It makes sense to look at the JJG later in the year, likely in November, after November Soybeans go off the board.
International Review
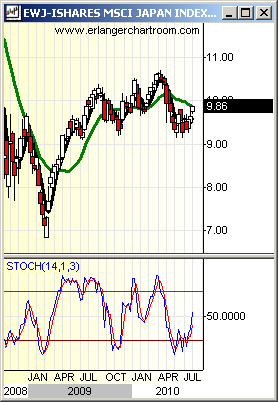
We highlight Japan this week. In our Monthly Report, due out later today, we discuss the Yen, which could consolidate in this area. The Yen has had a great run, and this has hurt Japanese equities. We show charts of the weekly EWJ (Japanese large caps), and the JOF (Japanese small caps), and suggest that these markets have held support and are likely to advance over the next few months. Both have held support and have already started to move up a bit.
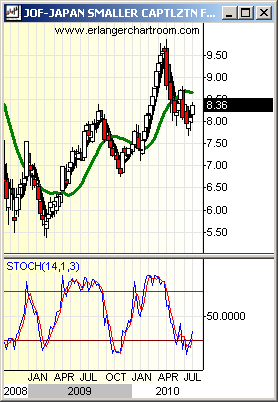
Weekly Chart of Interest
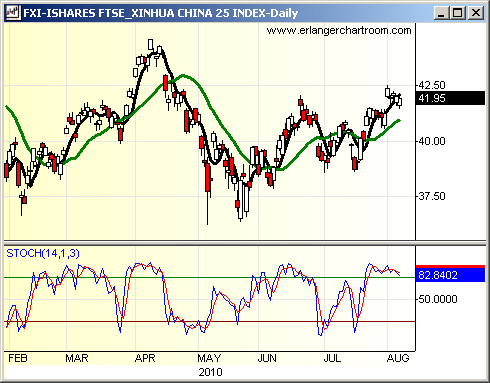
We show a daily chart of the FXI (China) below. Our accumulation model is very positive on this market and we note that in the recent correction this market held well above the May/June lows, while the SPY went below them. This suggests that the Chinese economy is set to outperform over the next few months.
Member Log In

Who is Fred Meissner, CMT?
Listen here:
The FRED Report is not authorized, endorsed, or affiliated with the Federal Reserve of St Louis and its FRED Economic Data.


