Search the Site
Research Piece: Seasonal Look at Agricultural Commodities
We will do this month’s research piece on seasonality analysis. I think most readers know what seasonality analysis is, but what makes it interesting is that this type of analysis has been traditionally applied to individual futures contracts, and not necessarily to ETFs. One thing about commodities that is essential to remember is that, unlike stocks, commodities have fundamental values that are very real. I say this, not to be funny, but rather to emphasize that commodities have real uses in the world while stocks are more nebulous. I have never eaten a stock certificate (although, at times, I have felt like doing so) but I HAVE eaten wheat, or corn, or steak. Seasonality is a part of these fundamentals and most commodity traders are aware of these relationships.
In some cases, such as the Petroleum complex, the relationship between the ETF and the underlying commodity is relatively easy to discern – after all, oil is oil; gas is gas, etc. To be completely precise and correct, the analyst has to compare ETF performance with the underlying commodity to make certain that patterns are the same. Often there are differences in magnitude, but in most cases patterns are the same.
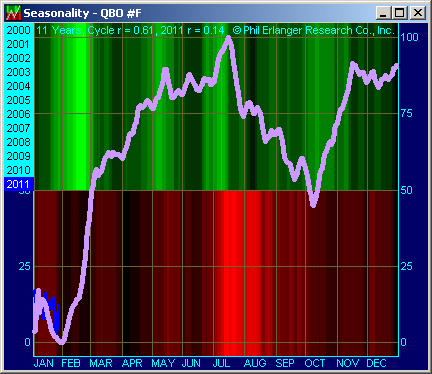
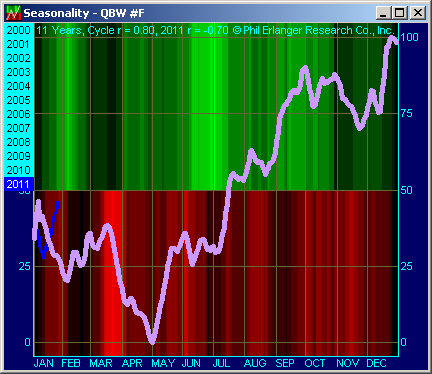
Where this becomes difficult is in some of the agricultural commodities. In many cases this is because there are differences in seasonal tendencies among the grains. For example, corn is primarily a feed grain, while wheat is mostly consumed by people. For this reason they have opposite seasonality – corn tends to peak in the summer months (as do cattle prices), while wheat normally increases during the summer months. Soybeans tend to peak as beans are harvested in the summer months, but the derivative products (Oil and Meal) have different seasonality. Bean Oil tends to bottom in the summer months, while meal peaks in the summer months. Meat futures tend to peak in the summer as well.
Here at the FRED Report, we follow JJG for our agricultural commodity exposure. While there is limited history of the ETF, the peak months going back to 2008 have been June/July in two out of three cases (2008, and 2009). When we look at the underlying makeup of the ETF it is: Corn, 37.88%, Soybeans 38.36%, and Wheat 23.75%. It follows that JJG should have a seasonal tendency to rally into the summer months. However, buyers of JJG should be on the lookout for news affecting Wheat prices – there could be a potential drag on prices that could cause JJG to perform less well than Beans or Corn.
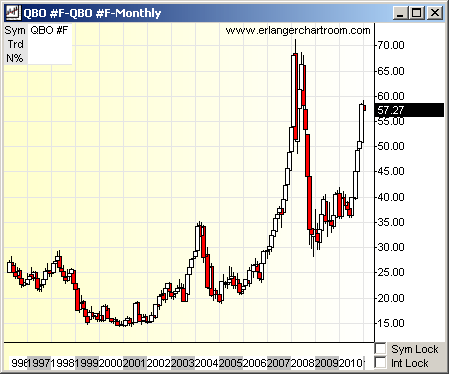
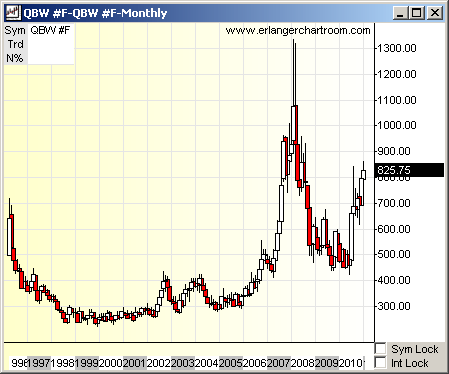
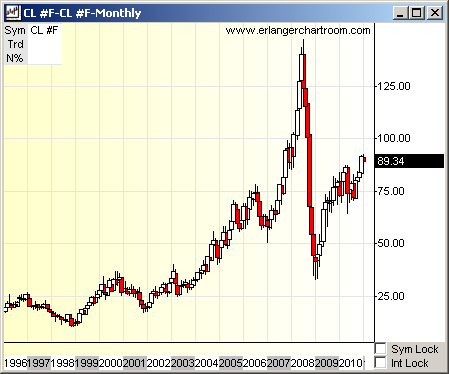
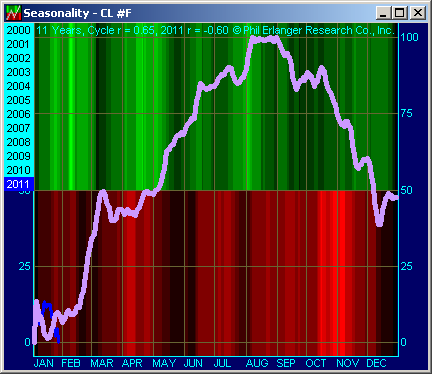
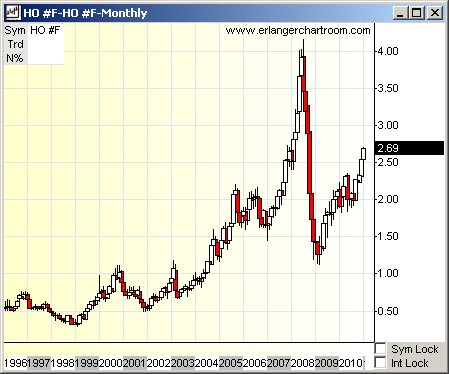
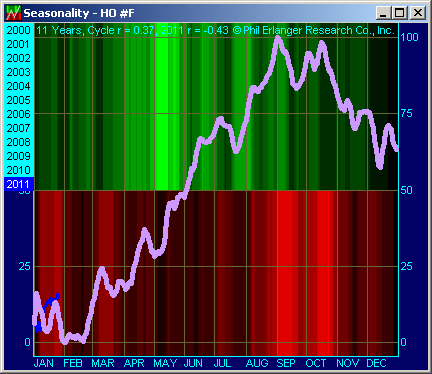
We include some charts of seasonality from Phil Erlanger Research, below. This seasonal work overlays the years of annual performance on top of each other on a January–December chart to come up with a yearly pattern (a full description can be found here: www.erlangerresearch.com/wpSeasonality.asp). The difference in seasonality of Wheat vs. Corn and Beans is obvious here. Other researchers have come up with different ways to present seasonality – for example, the old firm Conti Commodities used to break each commodity down into bull and bear years, and then calculate seasonality in each. Other researchers do other, more complicated calculations.
The following charts show price charts on the left hand side and seasonality charts on the right hand side. The pink line on the right hand chart is the directional line of the futures seasonal direction. The shading behind called the seasonal heat and is bright green if the corresponding time on the chart is in a positive seasonal cycle and red if in a poor seasonal cycle. If the background color is black, then there is no seasonal heat present at that time. These charts are produced at the beginning of each year and are not run again until the beginning of the next year.
We realize that most of our readers are not commodity traders. Our objective in this article is to provide an introduction to the concept of seasonality. For those who are interested, email and we will provide some additional references so you can learn more about seasonality, how it is presented and calculated, in the various commodity markets. However, we believe that some basic information on Seasonality will help advisors that use commodity based ETFs understand these tendencies better.
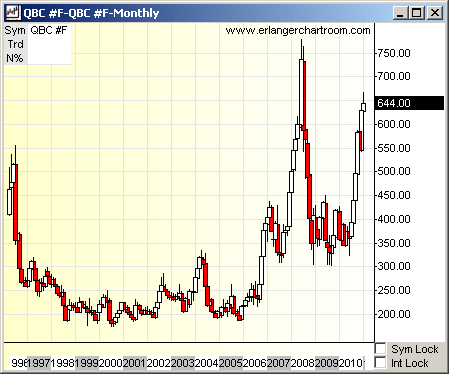
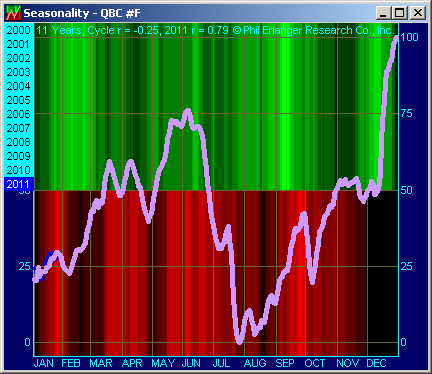
SOY BEAN FUTURES
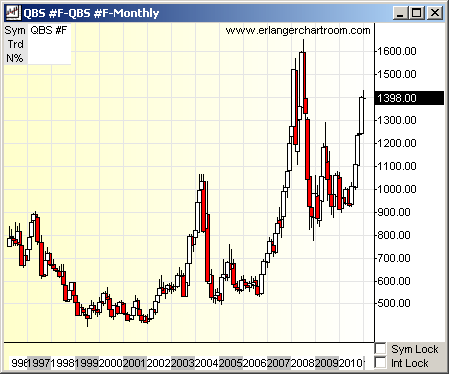
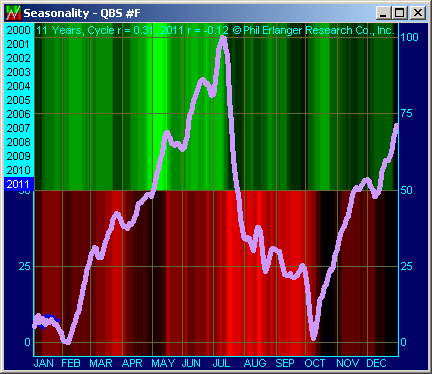
SOY OIL FUTURES
WHEAT FUTURES
LIGHT CRUDE
Member Log In

Who is Fred Meissner, CMT?
Listen here:
The FRED Report is not authorized, endorsed, or affiliated with the Federal Reserve of St Louis and its FRED Economic Data.


