Search the Site
Education and Training Center
Below are Technical Tools videos Fred Meissner completed for the Market Technicians Association:
Video Presentation: 9/12/12 CFA Presentation on how to use technical analysis: click here for video You can also download the presentation used on the screen here.
Adding Technical Studies in Thomson Charts: CLICK HERE
Technical Indicators:
Below is a listing and definition of various proprietary and non-proprietary technical indicators we rely on during our analysis of the markets.
Moving Averages:
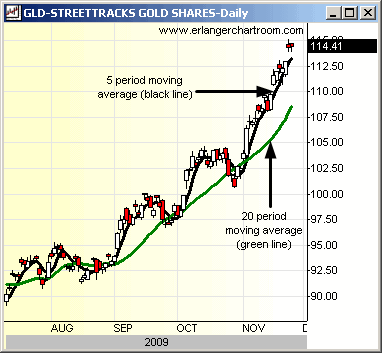
Moving averages are one of the building blocks of Technical Analysis, and there are almost as many ways to use this indicator as there are technicians.
At the FRED report we teach and use a dual moving average crossover system to determine trend. Our favorites are the 5 period and 20 period moving averages. We consider the trend to be up if the 5 is above the 20, and down if below it.

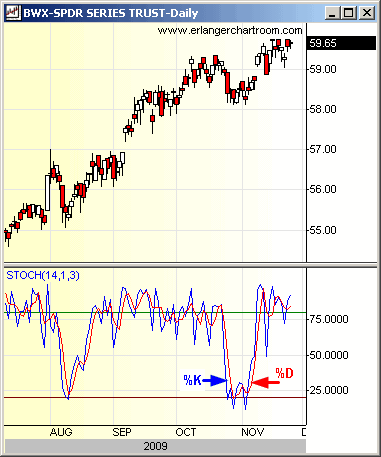
The Stochastic Oscillator is one of the commonly used momentum oscillators and is standard on charting programs. There are two lines on the chart below, %K and %D.
%K is the faster of the two lines, and represents a mathematical formula that measures where the current close is in relation to the trading range of the last “X” periods of time. We use a 14 period look-back, so in plain English %K says where the current close is in the trading range of the last 14 days, expressed as a %. The other line, %D, is a 3 period moving average of %K.
At the FRED report we use it somewhat differently than is commonly taught. The standard way to use the indicator is to register a buy signal when it moves below, and then above, 20 (the lowest 20% of closing prices in the last 14 days). A sell signal is when the indicator moves above, and then below 80 (the highest 80% of closes over the last 14 days).
We have found that the Stochastic is sensitive, so we advocate taking signals only in the direction of the trend. When looking at the standard FRED report chart, this would mean taking buy signals when the 5 period moving average (see above Moving Averages section) is above the 20 period moving average, and sell signals when the 5 is below the 20, but using a different technique to exit positions. The reason for this is due to the sensativity in the Stochastic, and can give early indications, especially in new trends. It also can get “stuck” in the direction of trends, which connotes strength and not weakness. See the chart below, of the BWX, for an illustration of this. Another, preferred interpretation, is to use the indicator to measure risk. An example: buy in an uptrend, not when the stochastic is at 90% but rather wait until it falls below 50%. This way, even if a stock, commodity, or ETF does not give one of the “classic” signals, you can still use the indicator to assess risk, and leg into positions.

Fred's Price Oscillator (FPO):
This is an oscillator that I invented, using a combination of high, low and closing prices. Unlike the Stochastic, which is really sensitive, this indicator is designed to be less sensitive. Other than that it is, of course, proprietary, so we do not disclose much about the construction of the indicator. One of the characteristics of the tool is that when the Oscillator moves below/above -15/15 the market often creates a divergence. For those of you who do not know that term it means that price will make a new low/high and the oscillator will not confirm it. That is usually the sign of a turn. On really sharp strong market moves, a couple of these divergences can occur. We use weekly data in our examples for you, as we have that data going back to the 1970’s on the SPX, and farther on the Dow Industrials, which work the same way. We would note that we keep FPO’s on the commodities, but rarely publish these, as most subscribers are interested in stocks. Like most oscillators it is most useful at bottoms, so our examples show bottoms. We can, and will, show some analysis of tops as they occur.
Above example: 1973 FPO
The strongest signal of the FPO is divergence, and at the 1973 you can see a triple divergence that has occurred at most major market lows. Note also how the highest high on the FPO occurred after the low had been reached.
Above example: 1980 FPO
As in the chart of the FPO in 1973, the FPO had a triple divergence, and the Oscillator made new six- month highs showing strong momentum, after the low had been reached.
Above example: 2002 FPO
The 2002 low also had a triple divergence although it was more spread out over the time period and we had no new highs.
Fred's Breadth Oscillator (FBO):
This is an Oscillator that I invented. Unlike the McClellan Oscillator, which is sensitive and gives a lot of signals, this tool is more of a trend following indicator. It is proprietary to the FRED report, so we do not disclose much about the construction of the tool. It generally moves between 12 and 18. Moves below 12 or above 18 imply a divergence bottom or top is coming with fairly high probability. This tool works best at extremes, and patterns can be significant. It also gives clearer signals at bottoms than tops, although when tops are perceived to be occurring we will publish these charts, appropriately annotated. The FBO is only useful on stocks, where advance/decline data is published.
Above example: 1973 FBO
The 1973-1974 low was one of the strongest down-moves in market history, Even so, the FBO barely made new lows and reacted strongly at the lows.
Above example: 1982 FBO
The 1982 low was a classic case of triple divergence near the lows.
Above example:2002 FBO
The 2002 low was interesting as the indicator failed to rally as much as the market in December of 2002. This suggested that rally would be retraced. While there was not a divergence at the retracement low, in the traditional sense, the FBO maintained a solid uptrend, and then outperformed the upside at the second low.
Member Log In

Who is Fred Meissner, CMT?
Listen here:
The FRED Report is not authorized, endorsed, or affiliated with the Federal Reserve of St Louis and its FRED Economic Data.


